
Perl Weekly Challenge 165.
My solutions (task 1 and task 2 ) to the The Weekly Challenge - 165.
Task 1: Scalable Vector Graphics (SVG)
Submitted by: Ryan J Thompson

Scalable Vector Graphics (SVG) are not made of pixels, but
lines, ellipses, and curves, that can be scaled to any size
without any loss of quality. If you have ever tried to resize
a small JPG or PNG, you know what I mean by “loss of quality”!
What many people do not know about SVG files is, they are
simply XML files, so they can easily be generated
programmatically.

For this task, you may use external library, such as Perl’s
SVG library, maintained in recent years by our very own
Mohammad S Anwar. You can instead generate the XML yourself;
it’s actually quite simple. The source for the example image
for Task #2 might be instructive.

Your task is to accept a series of points and lines in the
following format, one per line, in arbitrary order:

Point: x,y

Line: x1,y1,x2,y2

Example:
53,10
53,10,23,30
23,30

Then, generate an SVG file plotting all points, and all
lines. If done correctly, you can view the output .svg file in
your browser.
This task comes right when I was trying to automate the generation of svg’s, as I learned that laser cutters may be driven through svg files. I’m planning a new version of my exposition ‘Light in Motion’ (Luz en Movimiento) using metallic plates instead of transparencies. I’ll write about it later. A couple of videos can be seen here and here.
I’ll translate Point: into an svg circle and Line: into an
svg line. There are some subleties regarding the scale of the
drawing, since I don’t know the range of the coordinates
beforehand. I’ll comment the issues and my solution within the
code. As I’m just learning about svg I guess better solutions
may be found.
 1  # Perl weekly challenge 165
 2  # Task 1: Scalable vector graphics (svg)
 3  #
 4  # See https://wlmb.github.io/2022/05/20/PWC165/#task-1-scalable-vector-graphics-svg
 5  use v5.12;
 6  use warnings;
 7  use SVG;
 8
 9  # Parameter definitions
10  my $relative_radius=0.01; # size of point vs. canvas size
11  my $relative_width=0.005; # width of stroke vs. canvas size
12  my $absolute_size=400; # absolute size of canvas
13  my $fill="red"; # fill color
14  my $stroke="blue"; # stroke color
15
16  # Initialize svg object
17  my $svg=SVG->new(width=>$absolute_size, height=>$absolute_size);
18
19  # make group for transforming coordinates
20  my $g=$svg->group();
21
22  my @bbox; # required bounding box
23  while(<>){ # read input
24      chomp;
25      my @coords=split /\s*,\s*/; # interpret as comma separated coordinates
26      # two coordinates for point, four for line
27      die "Expected x,y or x1,y1,x2,y2 coordinates" unless @coords==2 || @coords==4;
28      $g->circle(cx=>$coords[0], cy=>$coords[1], fill=>$fill) if @coords==2;
29      $g->line(x1=>$coords[0],y1=>$coords[1],x2=>$coords[2],y2=>$coords[3], stroke=>$stroke)
30          if @coords==4;
31      adjust_bbox(@coords[(0,1)]); # acomodate bounding box to new coordinates
32      adjust_bbox(@coords[(2,3)]);
33  }
34  my ($Lx, $Ly)=($bbox[2]-$bbox[0], $bbox[3]-$bbox[1]); # Get size of canvas in user coords.
35  $Lx||=1; # default size
36  $Ly||=1;
37  my $L=$Lx>$Ly?$Lx:$Ly; # make square canvas
38  my $radius=$relative_radius*$L; # radius of point
39  my $width=$relative_width*$L; # and stroke width in user coords
40  my $scale=$absolute_size/($L+2*$radius); # scale user to canvas coords
41  for(0,1){ # enlarge bounding box to accommodate radius of points at extremes
42      $bbox[$_]-=$radius;
43      $bbox[$_+2]=$bbox[$_]+$L+2*$radius;
44  }
45  # set radius of all circles
46  $_->setAttribute("r", $radius) for $g->getElements("circle");
47  # set stroke widths of all lines
48  $_->setAttribute("stroke-width", $width) for $g->getElements("line");
49  # set a coordinate transformation from user to canvas coordinates.
50  $g->setAttribute("transform", "scale($scale, -$scale) translate(".-$bbox[0].",".-$bbox[3].")");
51  say $svg->xmlify; # output the svg code
52
53  sub adjust_bbox { # enlarge the bounding box to accommodate a point
54      my ($x, $y)=@_;
55      return unless defined $x and defined $y;
56      for ([0, $x, 1], [1, $y, 1], [2, $x, -1], [3, $y, -1]){
57  	my ($i,$z, $s)=@$_;
58  	$bbox[$i]=$z if !defined $bbox[$i] or $s*$z<$s*$bbox[$i];
59      }
60  }
61
I took advantage of the capabilities of ŧhe package
SVG::DOM, included by SVG, to set attributes of previously
defined objects, as in lines 46, 48 and 50 of the script
above. In svg increasing y in canvas coordinates corresponds to a downward
motion. In line 50 I use a negative vertical scaling so that
increasing y in user coordinates corresponds to an upward
motion.
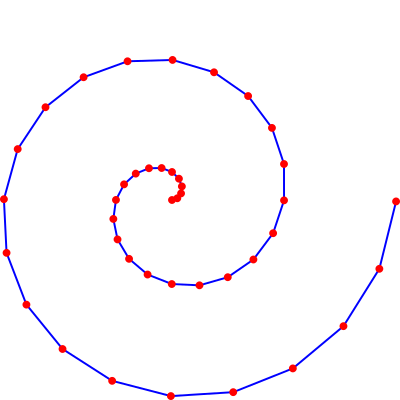
Example: I use a perl script to generate points along a spiral and feed them to my program.
perl -E ' ($r,$s)=(0,0);($p,$q,$r,$s)=($r,$s,$_*cos($_),$_*sin($_)),
say "$p,$q,$r,$s"  for map {$_*3.14/10} (1..40);
say $_*cos($_),",",$_*sin($_) for map {$_*3.14/10} (0..40);
'|./ch-1.pl >fig2.svg
Result (after conversion to png):
Task 2: Line of Best Fit
Submitted by: Ryan J Thompson
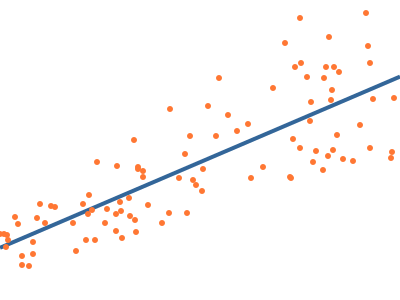
When you have a scatter plot of points, a line of best fit is
the line that best describes the relationship between the
points, and is very useful in statistics. Otherwise known as
linear regression, here is an example of what such a line
might look like:
The method most often used is known as the least squares
method, as it is straightforward and efficient, but you may
use any method that generates the correct result.

Calculate the line of best fit for the following 48 points:

333,129  39,189 140,156 292,134 393,52  160,166 362,122  13,193
341,104 320,113 109,177 203,152 343,100 225,110  23,186 282,102
284,98  205,133 297,114 292,126 339,112 327,79  253,136  61,169
128,176 346,72  316,103 124,162  65,181 159,137 212,116 337,86
215,136 153,137 390,104 100,180  76,188  77,181  69,195  92,186
275,96  250,147  34,174 213,134 186,129 189,154 361,82  363,89

Using your rudimentary graphing engine from Task #1, graph all
points, as well as the line of best fit.
Given a set of N points (xk,yk), the least squares method chooses the optimum slope m and intercept b in order to minimize the sum of squared errors E=∑k (yk-m xk-b)2. Deriving E with respect to m and b and setting the partial derivatives to 0 yield the linear equations ∑k (yk-m xk-b) xk=0 and ∑k (yk-m xk-b) =0, which may be written as (∑k xk2)m+(∑k xk) b=∑k yk xk and (∑k xk)m + N b = ∑k yk, with solution m=(N∑k yk xk-∑k xk ∑l yl)/(N∑k xk2-(∑k xk)2) and b=((∑k xk2)(∑l yl)-(∑k xk)(∑l xl yl))/(N(∑k xk2)-(∑k xk)2).
I use the Perl Data Language (PDL) to process the input data. I
evaluate the formulas above, although PDL has facilities for
computing least squares fits.
perl -MPDL -E '$d=pdl($ARGV[0]); $N=$d->dim(1); $s=$d->transpose->sumover; ($sx, $sy)=$s->list;
$s2=($d**2)->transpose->sumover; ($sx2, $sy2)=$s2->list; $sxy=$d->prodover->sumover;
$m=($N*$sxy-$sx*$sy)/($N*$sx2-$sx**2); $b=($sx2*$sy-$sx*$sxy)/($N*$sx2-$sx**2);
say "m=$m, b=$b";
' "[[333,129],  [39,189], [140,156], [292,134], [393,52],  [160,166], [362,122],  [13,193],
    [341,104], [320,113], [109,177], [203,152], [343,100], [225,110], [23,186], [282,102],
    [284,98],  [205,133], [297,114], [292,126], [339,112], [327,79],  [253,136], [61,169],
    [128,176], [346,72],  [316,103], [124,162], [65,181], [159,137], [212,116], [337,86],
    [215,136], [153,137], [390,104], [100,180], [76,188],  [77,181],  [69,195],  [92,186],
    [275,96],  [250,147],  [34,174], [213,134], [186,129], [189,154], [361,82],  [363,89]]"
Results:
m=-0.299956500261231, b=200.132272535582
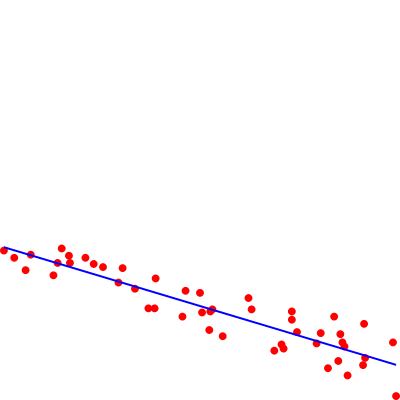
I modify the code to output the points and the adjusted line in a format that can be input to the previous program:
perl -MPDL -E '$d=pdl($ARGV[0]); $N=$d->dim(1); $s=$d->transpose->sumover; ($sx, $sy)=$s->list;
$s2=($d**2)->transpose->sumover; ($sx2, $sy2)=$s2->list; $sxy=$d->prodover->sumover;
$m=($N*$sxy-$sx*$sy)/($N*$sx2-$sx**2); $b=($sx2*$sy-$sx*$sxy)/($N*$sx2-$sx**2);
say join ",", @$_ for @{$d->unpdl}; $x=$d->slice("(0)"); ($x0,$x1)=($x->minimum,$x->maximum);
say sprintf "%f,%f,%f,%f", $x0, $m*$x0+$b,$x1,$m*$x1+$b;
' "[[333,129],  [39,189], [140,156], [292,134], [393,52],  [160,166], [362,122],  [13,193],
    [341,104], [320,113], [109,177], [203,152], [343,100], [225,110], [23,186], [282,102],
    [284,98],  [205,133], [297,114], [292,126], [339,112], [327,79],  [253,136], [61,169],
    [128,176], [346,72],  [316,103], [124,162], [65,181], [159,137], [212,116], [337,86],
    [215,136], [153,137], [390,104], [100,180], [76,188],  [77,181],  [69,195],  [92,186],
    [275,96],  [250,147],  [34,174], [213,134], [186,129], [189,154], [361,82],  [363,89]]
" | ./ch-1.pl >fig3.svg
Result:
The full code is
 1  # Perl weekly challenge 165
 2  # Task 2: Line of best fit
 3  #
 4  # See https://wlmb.github.io/2022/05/20/PWC165/#task-2-line-of-best-fit
 5  use v5.12;
 6  use warnings;
 7  use PDL;
 8  die 'Usage: ./ch-2.pl "[[x1,y1], [x2,y2]...]" to fit a set of points' unless @ARGV==1;
 9  my $input=pdl($ARGV[0]);
10  my $N=$input->dim(1); # number of points
11  die 'Require more than one point' unless $N>1;
12  my $sum=$input->transpose->sumover;
13  my ($sum_x, $sum_y)=$sum->list;
14  my $sum_2=($input**2)->transpose->sumover; # sum of squares
15  my ($sum_x_2, $sum_y_2)=$sum_2->list;
16  my $sum_xy=$input->prodover->sumover; # sum of xy
17  my $det=$N*$sum_x_2-$sum_x**2;
18  die "Singular system" if $det==0;
19  my $slope=($N*$sum_xy-$sum_x*$sum_y)/$det;
20  my $intercept=($sum_x_2*$sum_y-$sum_x*$sum_xy)/$det;
21  say join ",", @$_ for @{$input->unpdl}; # output points
22  my $x=$input->slice("(0)"); # x coords
23  my ($y0, $y1)=map {$slope*$_+$intercept} (my ($x0,$x1)=($x->minimum,$x->maximum));
24  say "$x0, $y0, $x1, $y1";
Example:
./ch-2.pl "
    [[333,129],  [39,189], [140,156], [292,134], [393,52],  [160,166], [362,122],  [13,193],
    [341,104], [320,113], [109,177], [203,152], [343,100], [225,110], [23,186], [282,102],
    [284,98],  [205,133], [297,114], [292,126], [339,112], [327,79],  [253,136], [61,169],
    [128,176], [346,72],  [316,103], [124,162], [65,181], [159,137], [212,116], [337,86],
    [215,136], [153,137], [390,104], [100,180], [76,188],  [77,181],  [69,195],  [92,186],
    [275,96],  [250,147],  [34,174], [213,134], [186,129], [189,154], [361,82],  [363,89]]
" | ./ch-1.pl >fig4.svg
The resulting figure agrees with the previous one.