Use of Photonic
Introduction
Photonic is a perl package for calculations on photonics and metamaterials available from CPAN and from Github. It is a modular package using an object system to perform calculations about optical properties of systems with arbitrary geometry and composition. I prepared a couple of examples which may serve as an introduction. A more comprehensive manual is in my plans.
Simple example on the use of the package.
As every perl program, it must begin by loading the modules to use:
use warnings;
use strict;

use feature qw(say);

use PDL;
use PDL::NiceSlice;
use PDL::Complex;
use PDL::Graphics::Gnuplot;

use Photonic::Geometry::FromB;
use Photonic::LE::NR2::AllH;
use Photonic::LE::NR2::EpsL;
The package Photonic::Geometry::FromB defines all the geometric
attributes of the system given a characteristic funcion (B). In the
code below, we take a circle of radius (R), taken as a fraction of the lattice
parameter (a) of a square lattice.
my $N=50;                    # We take 2*$N+1 as the number of pixels
my $a=2*$N+1;                # on each side
my $R=0.3*$a;                # Define the radius of the circle
my $B=zeroes($a,$a)          # a square array of (*$2N+1)x(2*$N+1)
    ->rvals                  # compute the distance to the center
#                            # of the array
    <$R;                     # compare to $R
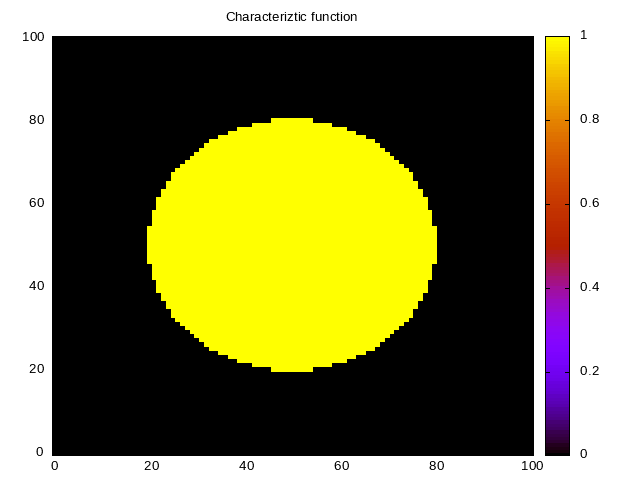
Thus, our characteristic function takes the value 1 within a circle of a given radius and 0 outside. We can visualize the geometry by plotting it.
my $win=gpwin('png', output=>'../../../../assets/image/20210220ejemplo0.png'); # initialize plotter
$win->plot(
    {title=>"Characteriztic function", view=>['equal','xy']},
    with=>'image', $B
    );
The result is in Fig. 6.

Now we construct a geometry object.
my $k=pdl(1,0); #Direction of the wavevector k+0 for G=0
my $geometry=Photonic::Geometry::FromB->new(B=>$B, Direction0=>$k);
The geometry object can produce lots of information about the object. For example, it may calculate the reciprocal lattice G, or a set of unit vectors in the direction of the reciprocal vectors. However, the case of the vector G =0 is special, as it has no intrinsic direction. Thus, we supplement the constructor above with the direction we require for this null vector. This corresponds to the longitudinal direction for the macroscopic field, i.e., it is the direction of the wavevector k of the macroscopic field in the nonretarded limit k→0.
Given a geometry, we can initialize a Haydock calculator object.
my $haydock_calculator=Photonic::LE::NR2::AllH->new(
    geometry=>$geometry,
    nh=>4*$N
    );
The notation above is the following: LE means we are using a set of
modules based on the longitudinal dielectric function, NR2 means to
use the non retarded methods for binary systems, and AllH means this
module obtains all Haydock coefficients corresponding to a given
geometry, stopping after the number of coefficients indicated by the
parameter nh or before, if there is convergence.
With a calculator of Haydock coefficients, we can proceed to construct an object to calculate the dielectric function.
my $epsilon_calculator=Photonic::LE::NR2::EpsL->new(
    nr=>$haydock_calculator,
    nh=>4*$N,
    );
This object may be used to obtain the complex dielectric function for any pair of values of the dielectric functions of the components (A) (the host) and (B) (the particles). We may use it as follows:
my $epsA=pdl(1)->r2C; # vacuum
say "epsA epsB epsM";
foreach(2..5){
    my $epsB=pdl($_)->r2C; # some dielectric
    my $epsM=$epsilon_calculator->evaluate($epsA, $epsB);
    say sprintf "%.3f %.3f %.3f", $epsA->re, $epsB->re, $epsM->re;
}
Or else, we may obtain full spectra as follows:
my $w=zeroes(100)->xlinvals(.1,1); # frequencies
my $tau=40; #lifetime
my $epsB=drude($w, $tau); # metallic particle
my $epsM=epsilonM($epsA, $epsB, $epsilon_calculator);
I have to define the function that computes the dielectric function of the circular inclusions. I use the Drude model for a given frequency and lifetime.
sub drude {
    my ($w, $tau)=@_;
    my $eps=defined $tau? 1-1/($w*($w+i/$tau)) : (1-1/$w**2)->r2C;
    return $eps;
}
I also need to define a function to calculate the dielectric function
for all the frequencies. For a single frequency I could call
$epsilon_calculator->evaluate($eps_A,$eps_B) , but I want to
calculate for all frequencies in a pdl-like manner.
sub epsilonM {
    my($epsA, $epsB, $eps, $res)=@_;
    $res//=null; #initialize result
    epsilonMaux($epsA,$epsB, $res, $eps);
    return $res->complex;
}
This function uses an auxiliary function that threads over the additional functions.
BEGIN {
    thread_define 'epsilonMaux(ea(2);eb(2);[o]em(2)), NOtherPars=>1',
    over {
	my $ea=shift;
	my $eb=shift;
	my $er=shift;
	my $eps=shift;
	$er.=$eps->evaluate($ea->cplx, $eb->cplx)
    };
}
This is a strange but useful way to define threadable functions in pdl. The idea is to define the function as if it would act on single objects. In this case, on the single complex dielectric function εa and the single complex dielectric dielectric function εb. Nevertheless, if supplied with a large pdl, with lots of dimensions and dielectric functions, then it iterates automatically over all extra dimensions.
As a comparison, we can calculate the response according to the 2D Maxwell-Garnett approximation.
my $f=$geometry->f; # filling fraction
my $beta=$f*($epsB-$epsA)/($epsA+$epsB); #~polarizability
my $epsMG=$epsA*(1+$beta)/(1-$beta); #Maxwell Garnett
Now we can plot the results using gnuplot.
$win=gpwin('png', output=>'../../../../assets/image/20210220ejemplo1.png'); # initialize plotter
$win->plot(
    {title=>
	 "Dielectric response of square array of Drude cylinders",
     xlabel=>"Frequency ω/ω_p",
     ylabel=>"ε",
    },
    with=>"lines", legend=>"Ph Re", $w, $epsM->re,
    with=>"lines", legend=>"Ph Im", $w, $epsM->im,
    with=>"lines", legend=>"MG Re", $w, $epsMG->re,
    with=>"lines", legend=>"MG Im", $w, $epsMG->im,
    );
The code may be run as
./ejemplo.pl
The table above results from the say statements in the code
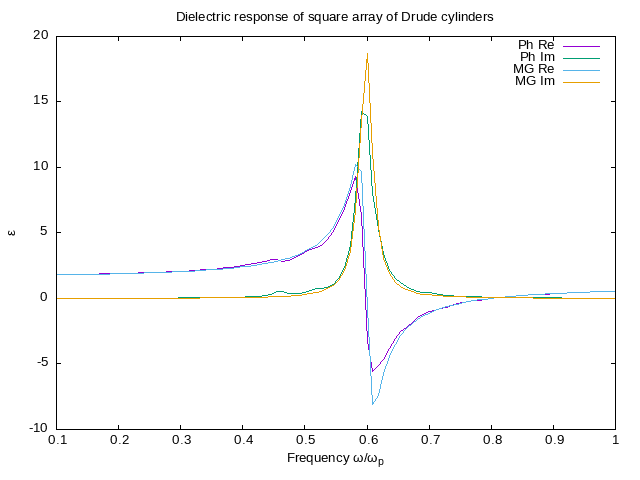
7. The spectrum is plotted in the next figure.

As can be seen, for this filling fraction Maxwell-Garnett is very close to the numerical calculation. For larger radii, the numerical calculation shows a dipolar peak that is further red-shifted from the surface plasmon of a single cylinder at ωsp=ωp/√2, and from the dipolar resonance of MG theory, while additional peaks appear closer to $ωsp corresponding to the excitations of multipoles higher than the dipole.
Example of a field calculation
I can also calculate the field. To that end I initialize a field calculator and a Haydock calculator. First I add similr boilerplate code as in the previous example.
use warnings;
use strict;

use feature qw(say);

use PDL;
use PDL::NiceSlice;
use PDL::Complex;
use PDL::Graphics::Gnuplot;

use Photonic::Geometry::FromB;
use Photonic::LE::NR2::AllH;
use Photonic::LE::NR2::Field;
use Photonic::Utils qw(tile vectors2Dlist);
I use the same geometry as above.
my $N=100;                    # We take 2*$N+1 as the number of pixels
my $a=2*$N+1;                # on each side
my $R=0.3*$a;                # Define the radius of the circle
my $B=zeroes($a,$a)          # a square array of (*$2N+1)x(2*$N+1)
    ->rvals                  # compute the distance to the center
#                            # of the array
    <$R;                     # compare to $R
my $k=pdl(1,0); #Direction of the wavevector k+0 for G=0
my $geometry=Photonic::Geometry::FromB->new(B=>$B, Direction0=>$k);
The Haydock calculator has to save the states, so I add the keepStates flag
my $haydock_calculator=Photonic::LE::NR2::AllH->new(
    geometry=>$geometry,
    keepStates=>1,
    nh=>4*$N
    );
I initialize the field constructor using this Haydock calculator.
my $field_calculator=Photonic::LE::NR2::Field->new(
    nr=>$haydock_calculator,
    nh=>4*$N);
I compute the field for given dielectric functions. I choose a dielectric function close to -1, the condition for surface plasmon resonance of a single cylinder.
my $eps_A_f=1+0*i; #vacuum
my $eps_B_f=-1.5+.1*i; #metallic close to resonance
my $field=$field_calculator->evaluate($eps_A_f, $eps_B_f);
To plot the fields I use some utility routines. I use tile to repeat
the unit cell a couple of times and I use vectors2Dlist to build a
vector field ready for plotting with gnuplot. As tile repeats a real
scalar field, I have to move the complex and cartesians indices before
and after tiling.
my $repetitions_x=2;
my $repetitions_y=2;
my $repeated_field=tile($field->mv(0,-1)->mv(0,-1), $repetitions_x, $repetitions_y)
		   ->mv(-1,0)->mv(-1,0);
my $repeated_field_abs=$repeated_field->Cabs2->sumover->sqrt;
my $repeated_field_dir=$repeated_field->re->norm;
my $scale=4; #size of arrows
my $decimate=10; #how many pixels between arrows
my @vector_list=vectors2Dlist($repeated_field_dir, $scale, $decimate);
my $win=gpwin('png', output=>'../../../../assets/image/20210220ejemplof.png'); #initialize plotter
$win->plot(
    {title=>"Field magnitud and direction", view=>['equal', 'xy'], , cbrange=>[0,25]},
    with=>'image', $repeated_field_abs,
    {lc=>3, lt=>1}, with=>'vectors', @vector_list);
For heavy calculations requiring many states and/or with a very large grid, maybe in 3D, it may be useful to save the states in a file instead of saving them in memory. This is easily done when initializing the Haydock calculator, by adding a filename, as in
my $stateFN="states.dat"; # File to save states
my $haydock_calculator_file=Photonic::LE::NR2::AllH->new(
    geometry=>$geometry,
    stateFN=>$stateFN, keepStates=>1,
    nh=>4*$N
    );
Then the rest of the program is identical but for this haydock calculator.
my $field_calculator_file=Photonic::LE::NR2::Field->new(
    nr=>$haydock_calculator_file,
    nh=>4*$N);
my $field_file=$field_calculator_file->evaluate($eps_A_f, $eps_B_f);
my $repeated_field_file=tile($field_file->mv(0,-1)->mv(0,-1),
   $repetitions_x, $repetitions_y)->mv(-1,0)->mv(-1,0);
my $repeated_field_file_abs=$repeated_field->Cabs2->sumover->sqrt;
my $repeated_field_file_dir=$repeated_field->re->norm;
my @vector_list_file=vectors2Dlist($repeated_field_file_dir, $scale, $decimate);
my $win1=gpwin('png', output=>'../../../../assets/image/20210220ejemplof1.png'); #initialize plotter
$win1->plot(
    {title=>"Field magnitud and direction", view=>['equal', 'xy'], , cbrange=>[0,25]},
    with=>'image', $repeated_field_file_abs,
    {lc=>3, lt=>1}, with=>'vectors', @vector_list_file);
I run the program.
./ejemplof.pl
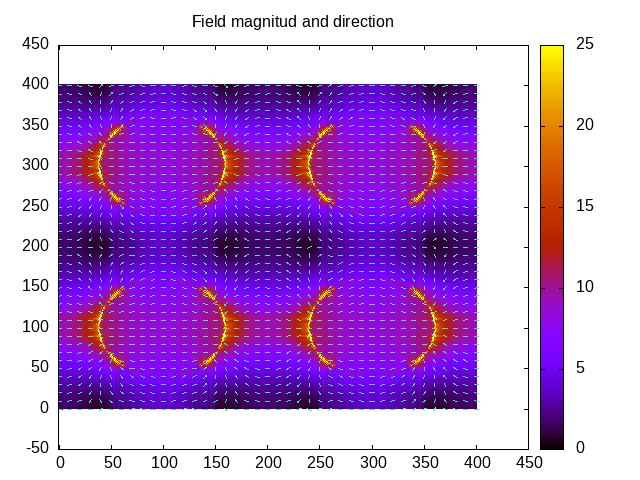
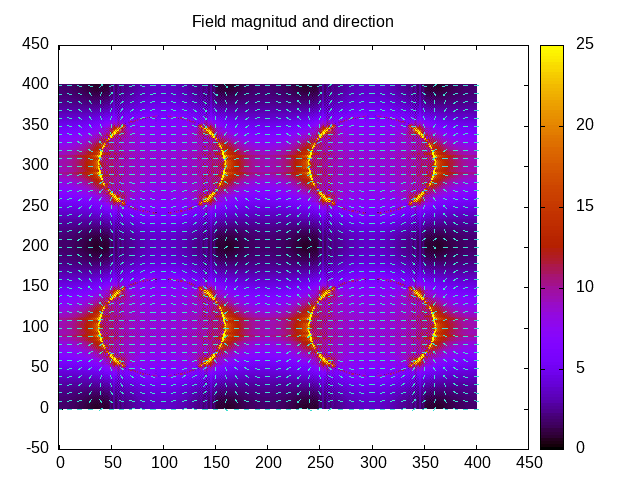
The result is in the following figures.


As expected, both images are identical. Furthermore, we have created a file with the states which may be used for other calculations.
ls -l states.dat
file states.dat

states.dat: cannot open `states.dat' (No such file or directory)